Graph Terms and Concepts
Graph Layout
Graph layout is the process of physically placing nodes and edges in space, for the purposes of visualising data structure. In other words, ordering the information for visual inspection
Graphs may be drawn manually, placing nodes and edges in specific positions. In the case of the London Underground map for example, node positions do not represent the actual geographical position of a station, but rather are approximations, stations being placed in a way designed to make the map easier to read and interpret.
For most networks however, graph layout is achieved by means of a layout algorithm that places nodes and edges according to sets of rules. There are numerous different types of layout algorithm, but perhaps the most commonly used kind are called force directed layout algorithms. The approach relies on simulating repulsive forces between all graph nodes and attractive forces between connected nodes, positioning them so these forces reach a minimal energy state.
It should be noted that the layout of a graph does not affect its properties, i.e. nodes still have the same number of edges and they connect in the same way, only how the information is displayed is different.
Node Degree
Simply put, node degree is the number of edges a node has. In directed graphs, you may talk about a node’s ‘in degree’ or ‘out degree’, referring to the edges that point at it or away from it respectively. The number and distribution of edges across a graph determines its topology.
Topology
A graph’s topology or structure is dependent on the source of data it represents and how nodes are connected to one another. Ultimately, this affects the appearance of the graph or its ‘shape’. Nodes with many edges may represent hubs and big graphs may look like ‘hairballs’. Alternatively, they may be highly structured entities with numerous areas of high connectivity leading to cliques within the graph structure. You can tell a lot about a given set of data by the topology of the graph it forms.
Components
A component is a subset of a graph in which there is a path of edges from every node to every other node within the component. A graph may have multiple components. In this case nodes in one component have no connectivity to those in any other component. In other words, each component represents an ‘island’ of data.
Attributes
Each node or edge may be associated with additional information, called attribute data. For example, if a node represents a person, we might also know information on that individual’s, age, height, weight, diet, etc.. In the case of edges, it may be that there are different values associated with them, for example correlation values, or they may represent a different source or kind of information that connects two entities.
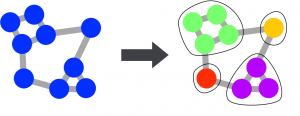
Clustering
One of the most useful approach to understanding the structure of a large graph is to perform a cluster analysis. Clustering is the process of dividing a graph into groups of nodes called clusters, based on their relative position within the overall topology of the graph. The theory being that areas of a graph represent communities where nodes possess similar properties or characteristics. There are numerous algorithms available to analyse graphs in this way, and they often have parameters to change the granularity of clustering. There is no simple answer to the question of what the ‘correct’ clustering of a graph is, but good visualisation allows one to use the results of a cluster analysis as a guide to see how it maps on to a graph’s structure.