Graphia is a powerful open source visual analytics application developed to aid the interpretation of large and complex datasets.
Graphia can create and visualise graphs from tables of numeric data and display the structures that result. It can also be used to visualise and analyse any data that is already in the form of a graph.
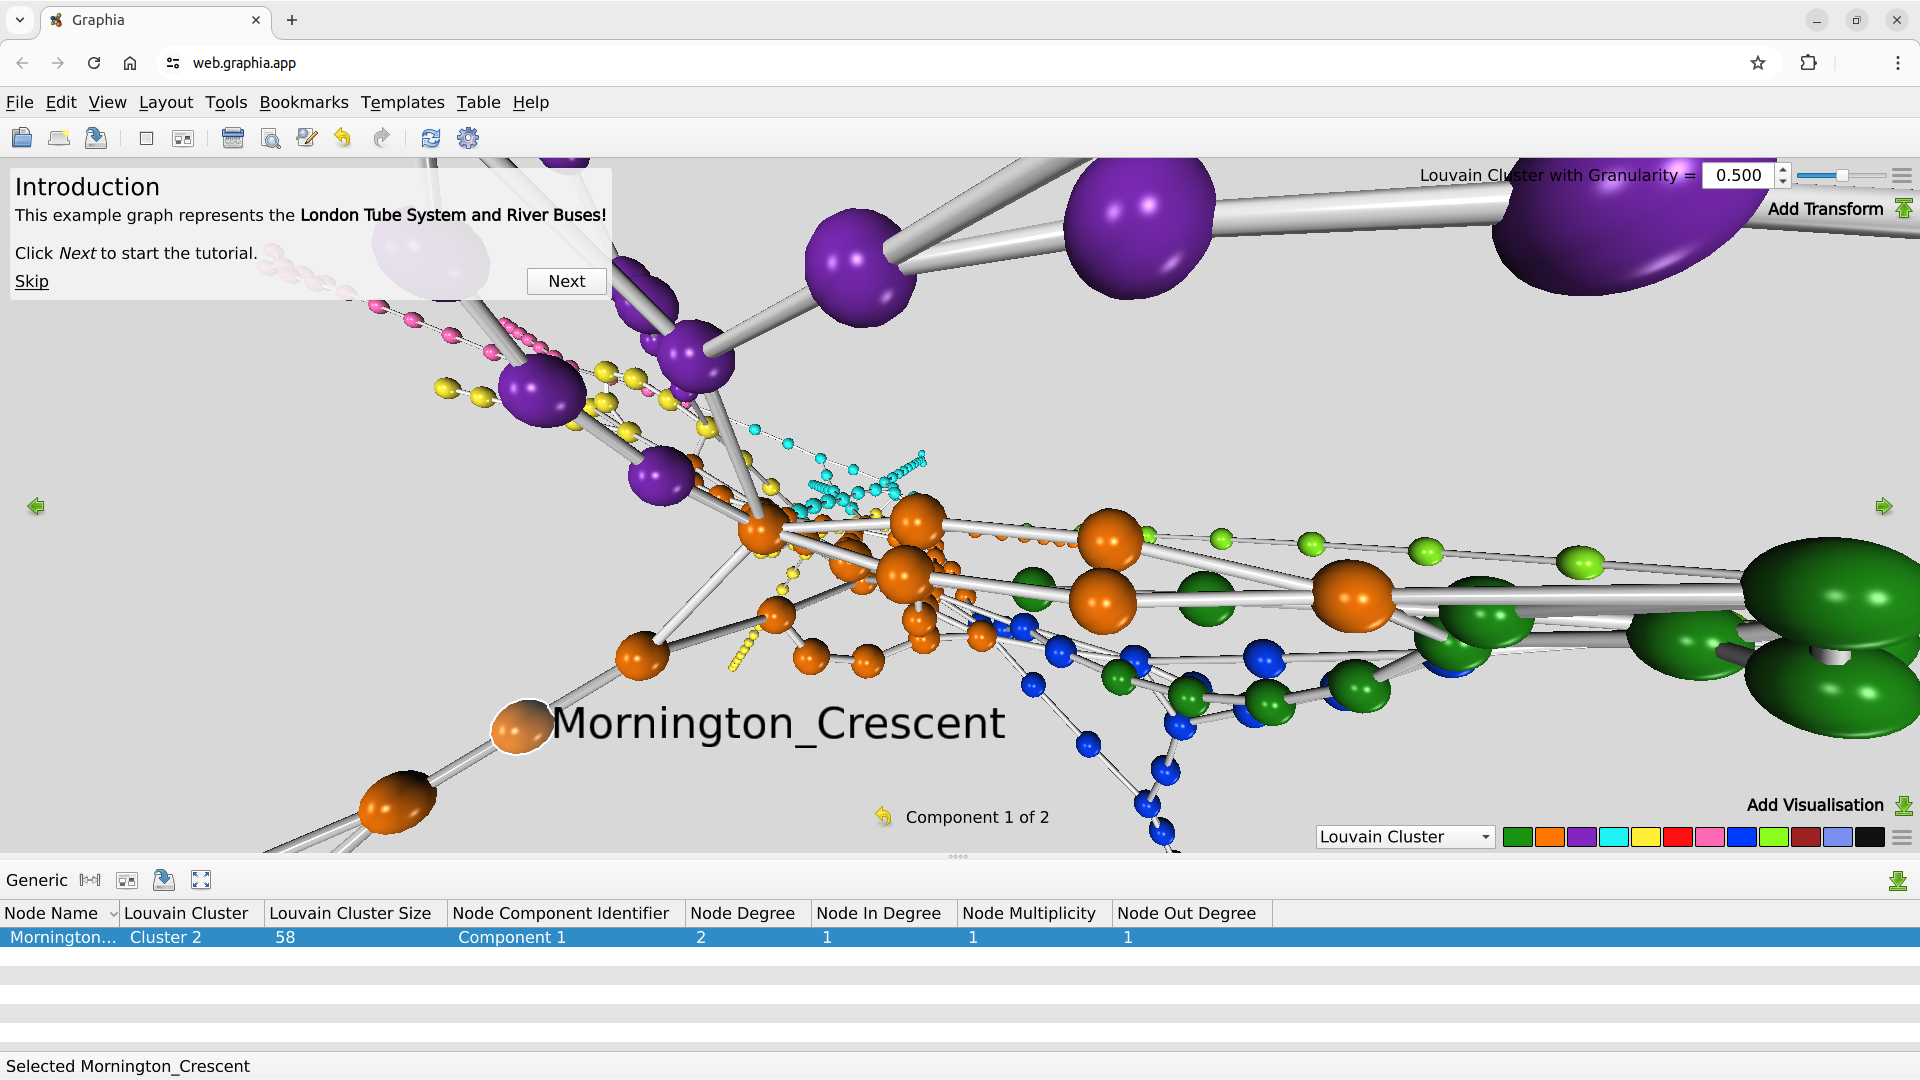
You can try Graphia directly on the web, without having to download it first.
Features
- Support for a variety of input data formats, ranging from raw CSV to GraphML
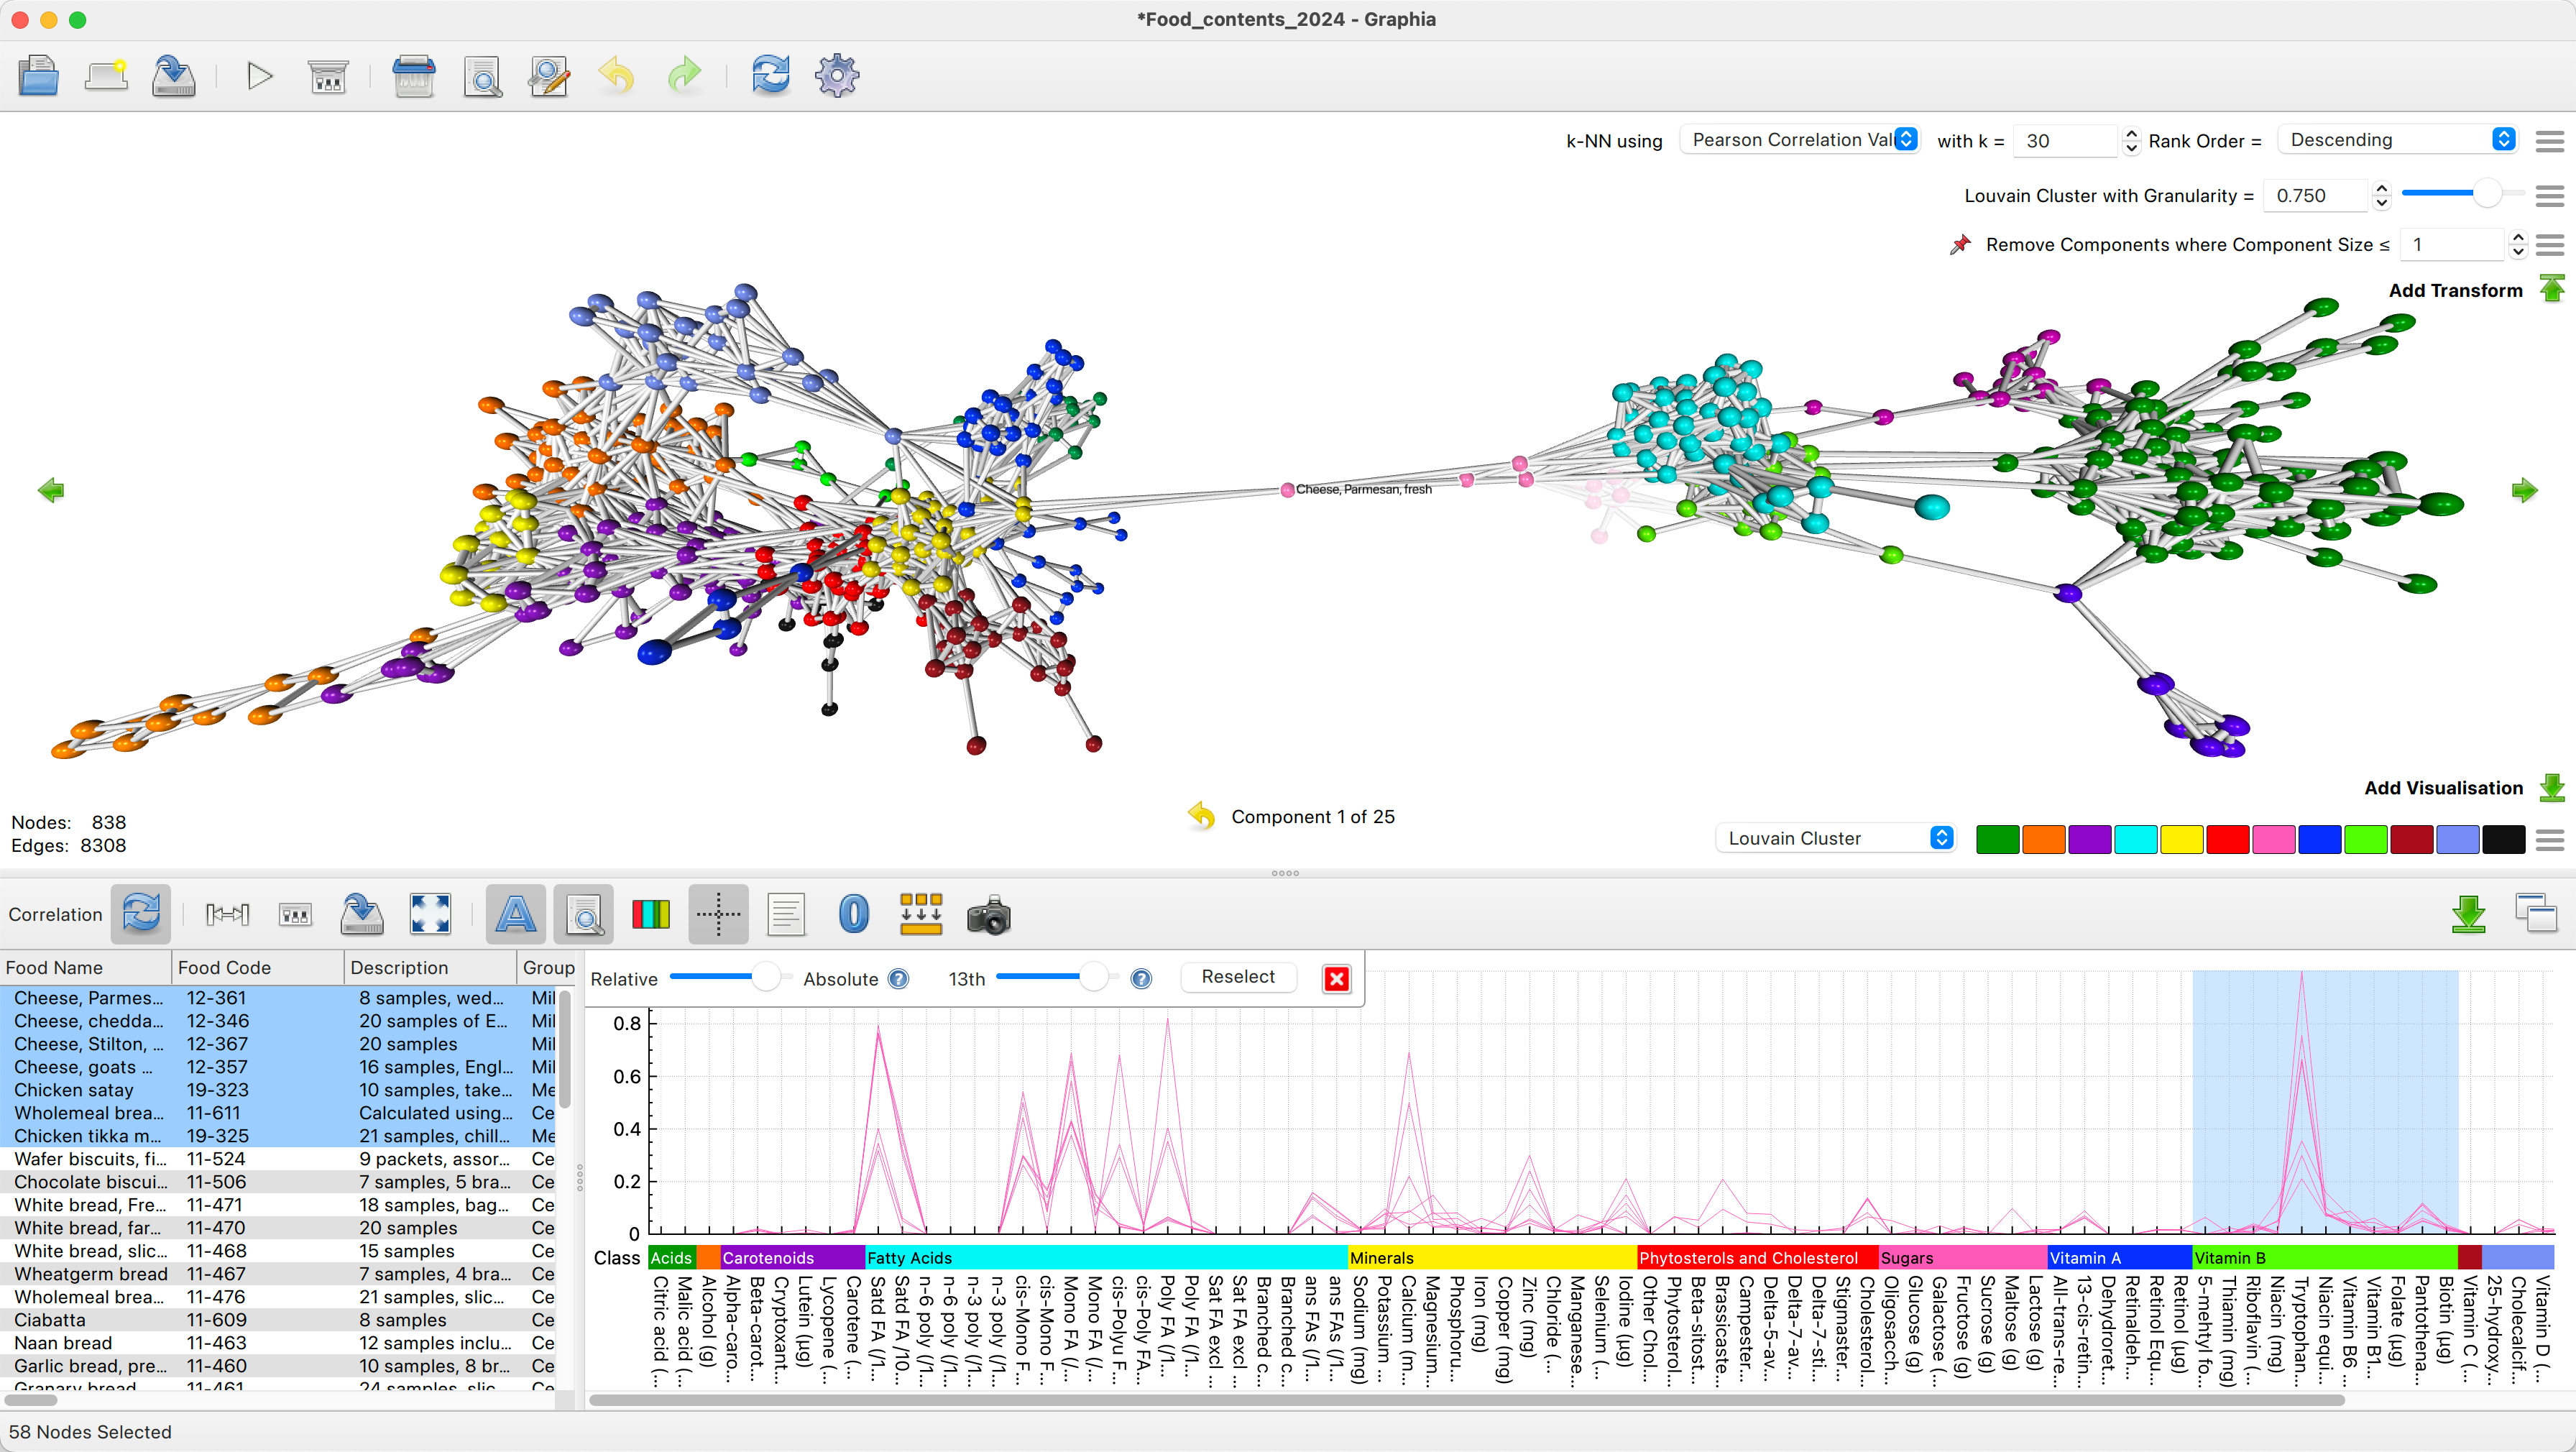
- Create correlation graphs using algorithms such as the Pearson Correlation Coefficient
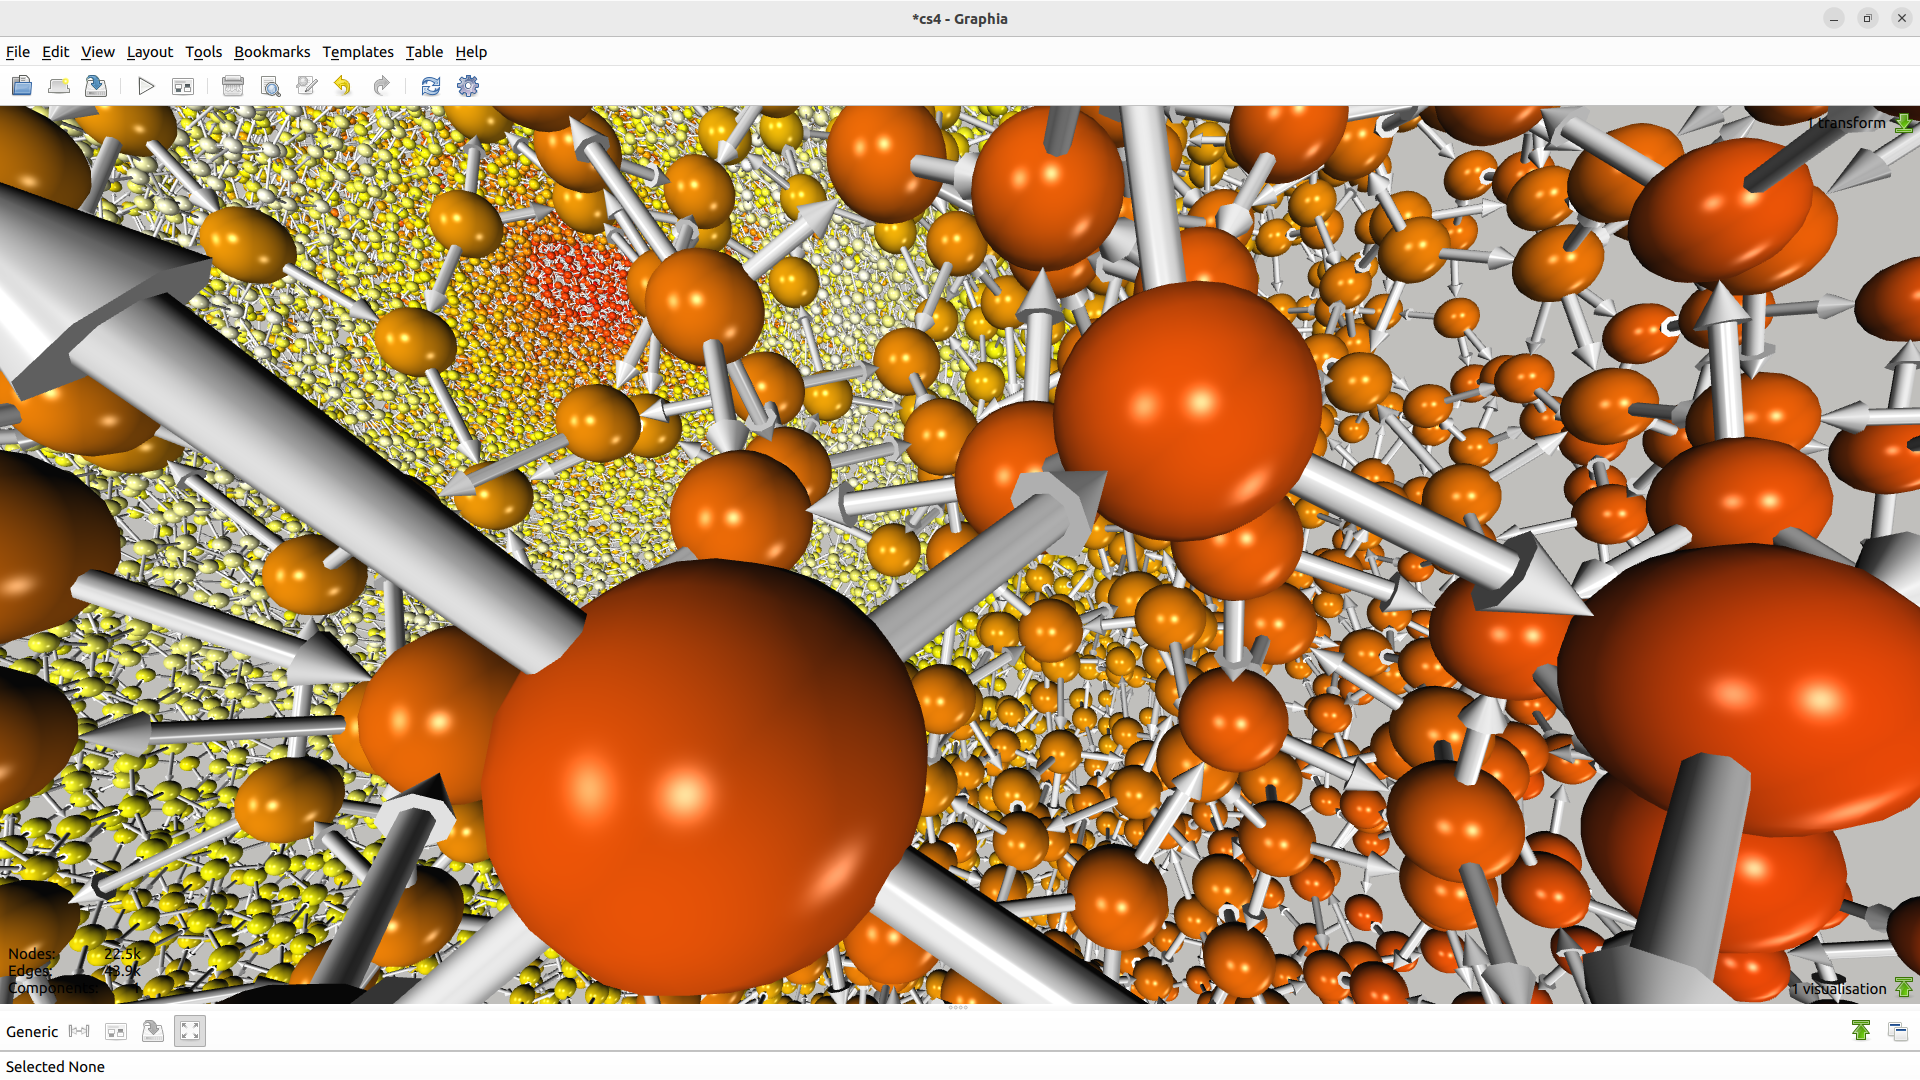
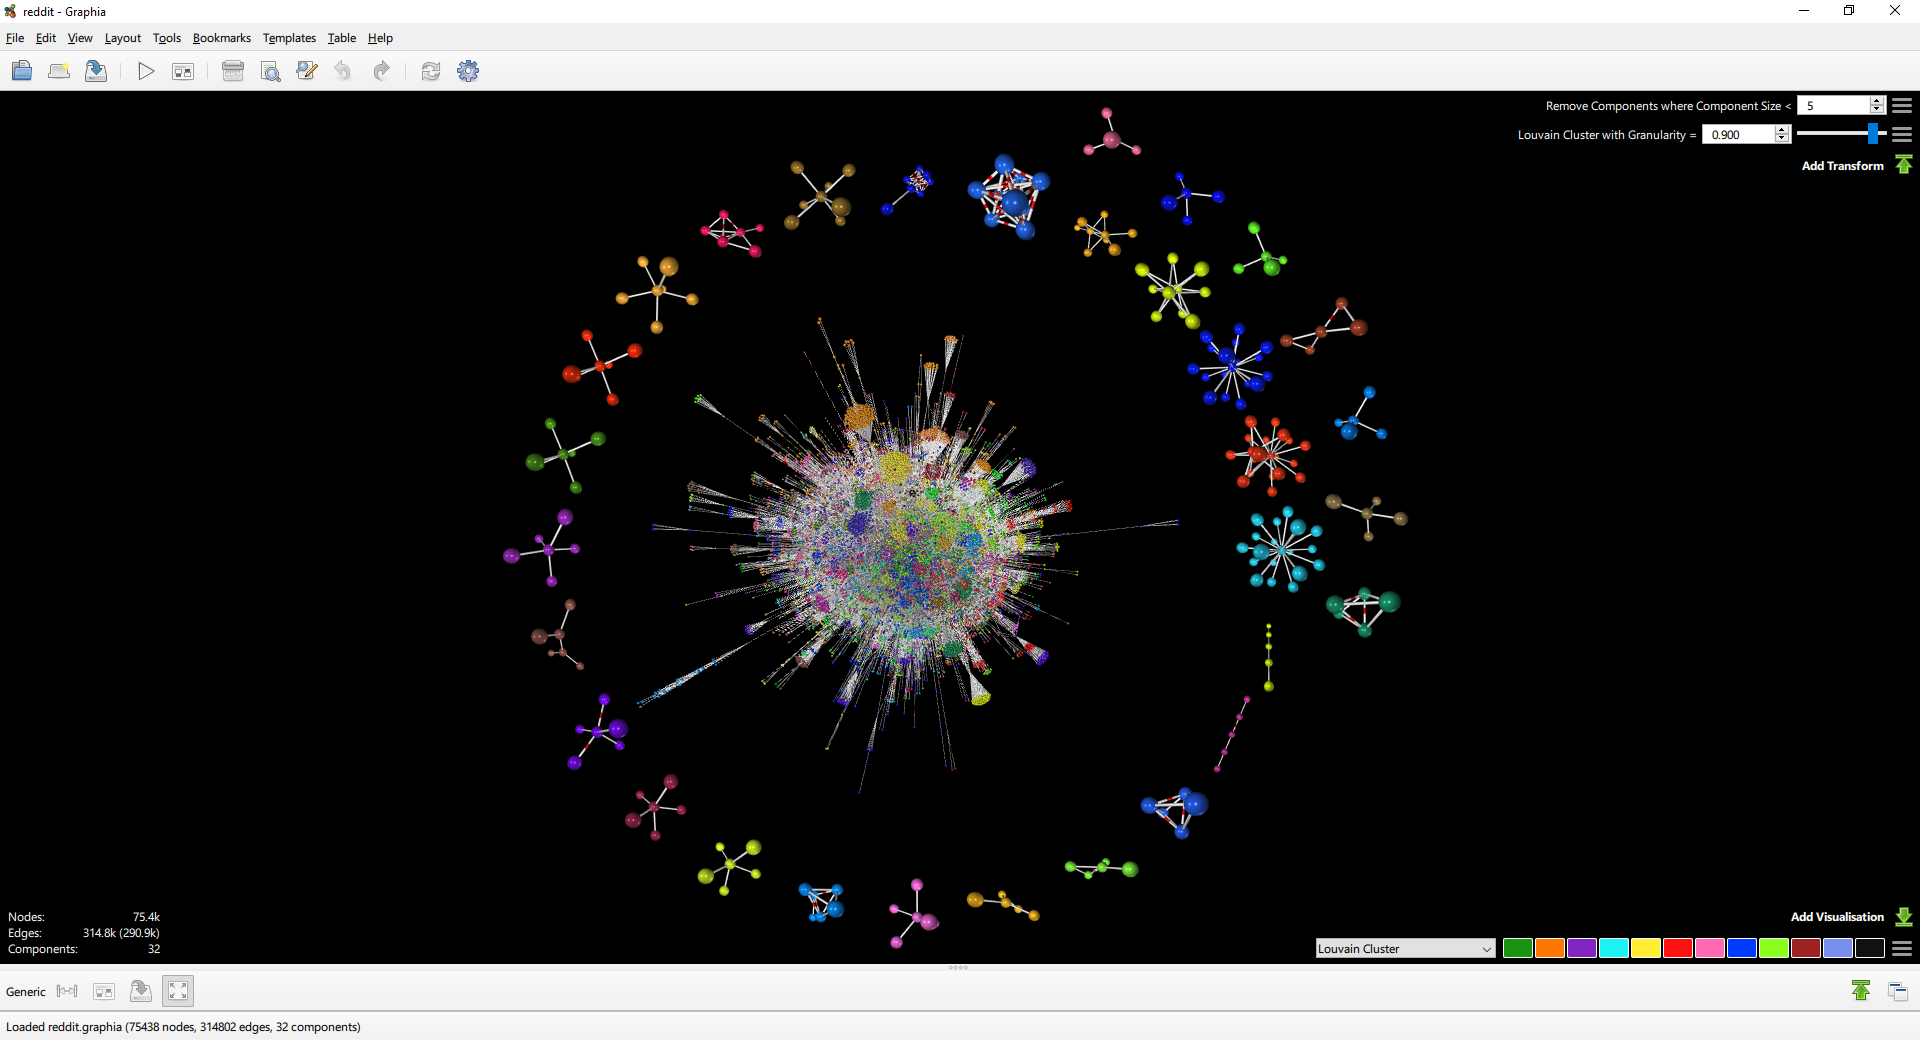
- Visualisation of millions of data points and relationships
- Interactive visualisation and layout in 2D or 3D
- Flexible search facilities, based on attribute information
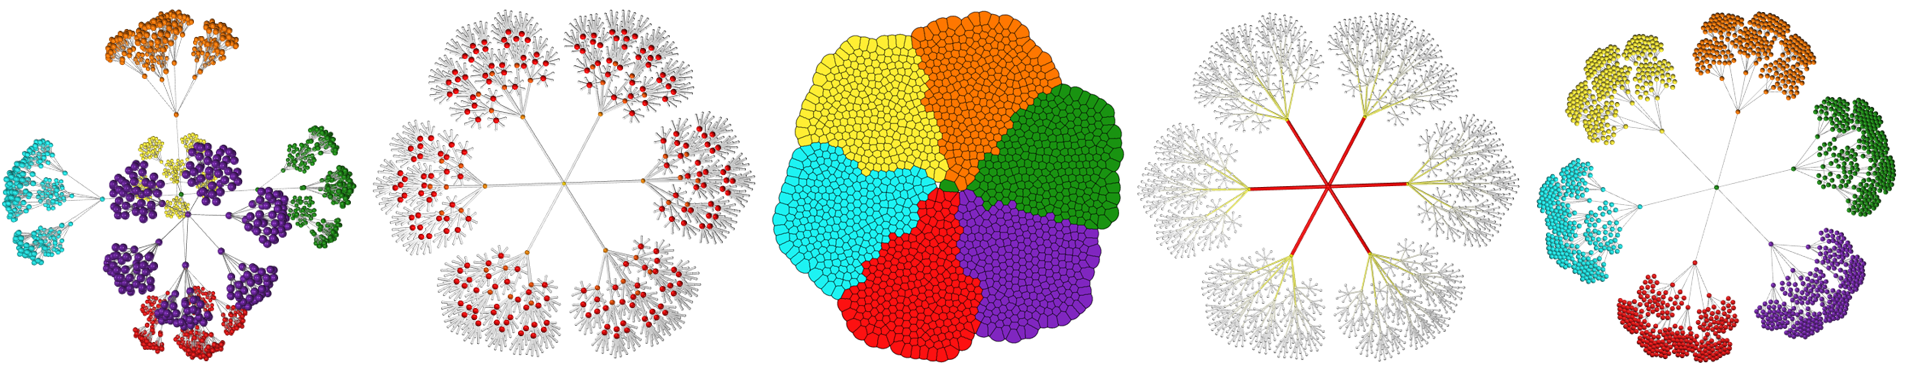
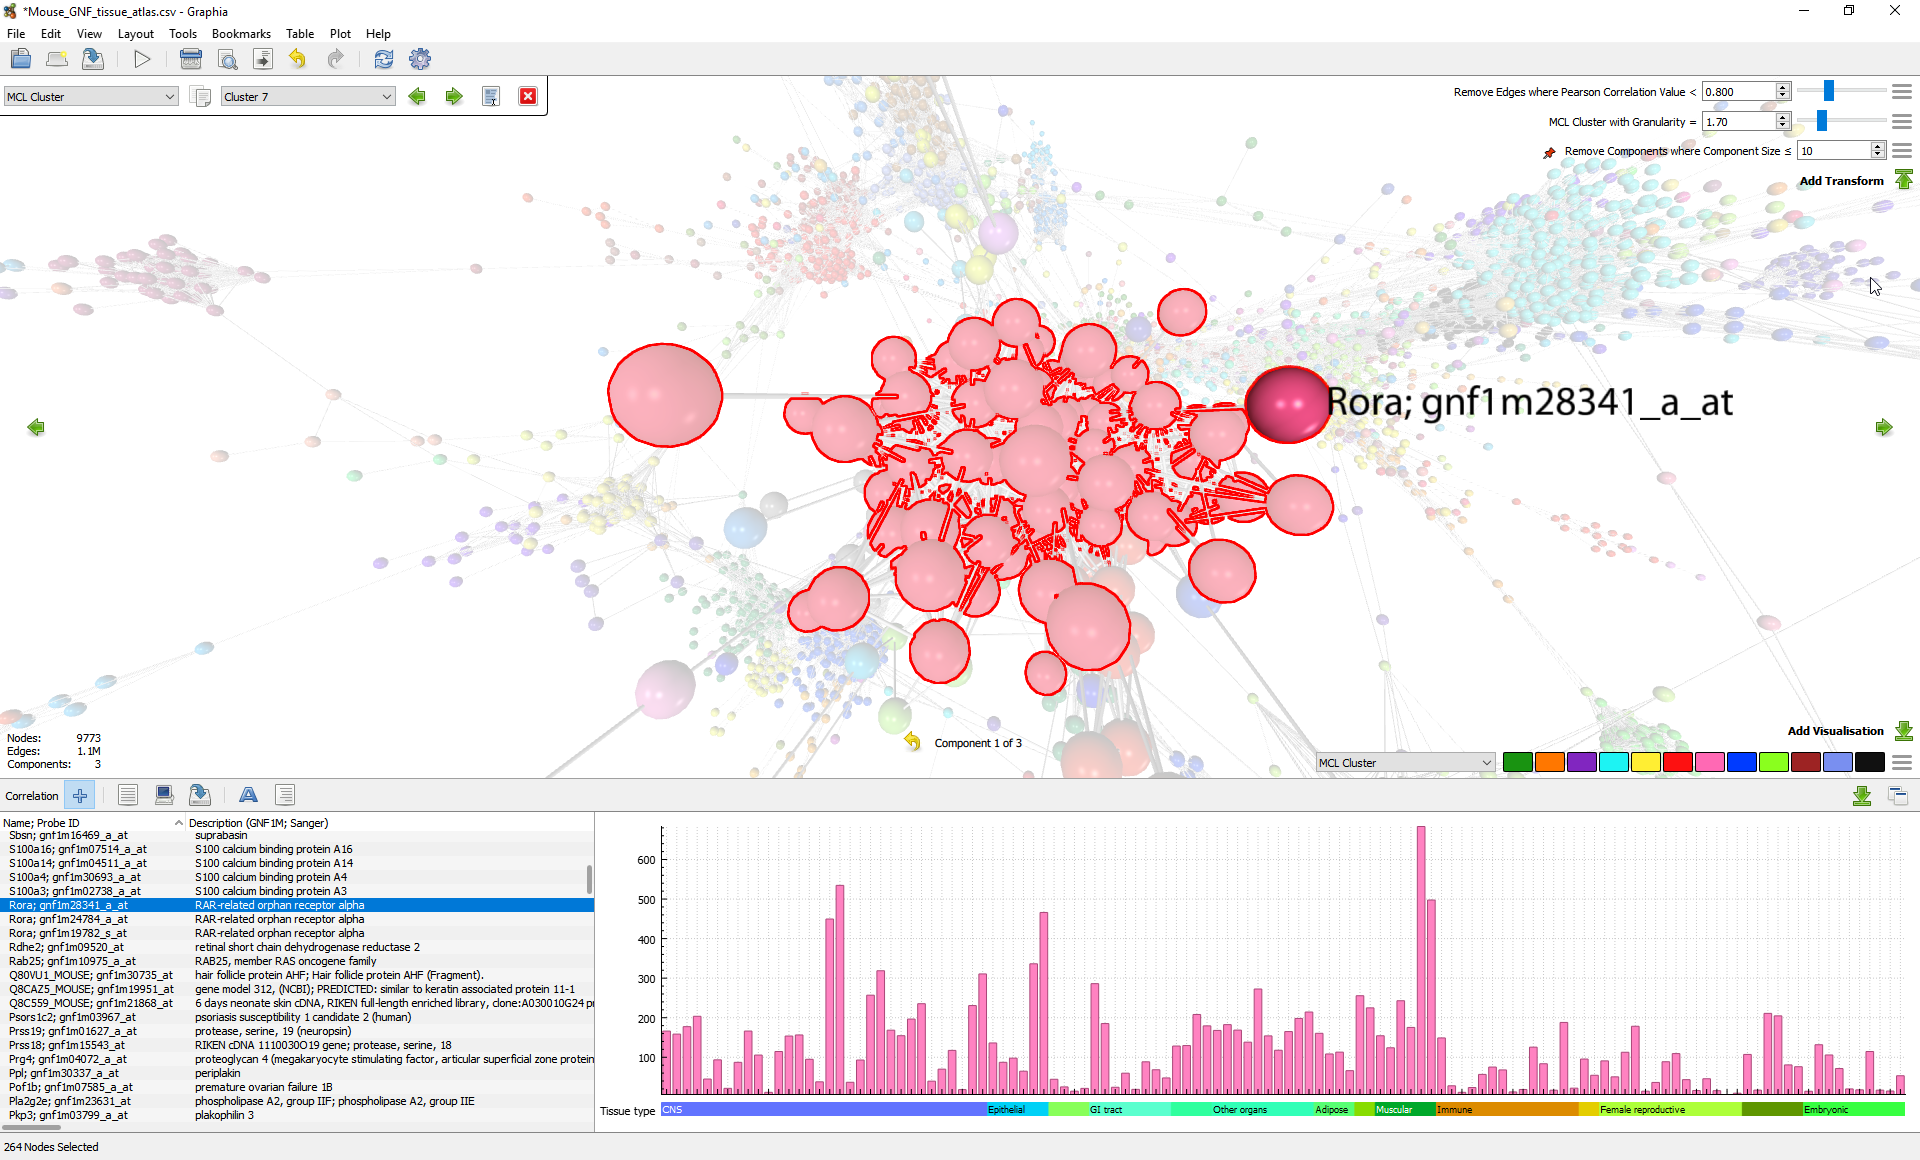
- Fast, tunable network clustering using Louvain or MCL algorithms
- Graph metric algorithms including PageRank, Betweeness and Eccentricity
- Enrichment Analysis
- Filter graph elements based on numeric or string based attribute expressions
- Customisable and simple to use web search
- Easy export and sharing of analysis results
Easy to use Interface - no programming skills required
Graphia is designed to be usable by any analyst on any desktop platform. Its intuitive graphical user interface means that powerful analytical algorithms and searches are just a click away!
Harnessing the Power of Visualisation - putting the analyst at the heart of the analysis
When data is visualised in an intuitive and interactive manner, it allows the analyst the tackle certain problems whose size and complexity make them otherwise intractable. Graphia couples computational algorithms with a visualisation interface that makes full use of the cognitive abilities of humans, providing deeper understanding and better communication of data.
Scalability - think big!
The world is full of large and complex data and Graphia has been designed to work with it. Every aspect of the tool has been optimised for maximum speed and performance, so you don’t have to wait.
Data Deconvolution - ultra fast pattern finding
Many analyses of complex data come down to a need to identify patterns and trends of interest. Graphia is designed to make this easy and quick by combining fast dynamic visualisations of data structure, with cluster analysis and the ability to explore the underlying data associated with the clusters observed.
Data Types
- Biological Sciences - protein interaction data, transcriptomics, single cell analyses, proteomics, metabolomics, multiparameter flow cytometry, genotyping data, medical imaging data
- Agritech - data relating to the performance of animals, crops, farms, etc.
- Fintech - any numerical data relating to changing variables over time, e.g. share prices or categorical data relating to the attributes of commercial entities
- Social Media - network connections between individuals, companies, etc.
- Text Mining - count matrices of words found across many documents
- Questionnaire - answers to questions are categorical (yes/no) or continuous (1-10)
About
Graphia is designed and built by a small group working in Edinburgh, UK and Philadelphia, USA. We are passionate about graphs, the power of visualisation and creating tools that aid the interpretation of complex data.
Our journey started 20 years ago, as we began to envisage how graphs could help us analyse the relationships between genes and proteins. Over this time we developed multiple tools and refined our approach, eventually arriving where we are today with Graphia. We believe it is the best option for interactively visualising large graphs.
If you have used Graphia in a scientific publication, we would appreciate citations to the following paper:
Tom C. Freeman, Sebastian Horsewell, Anirudh Patir, Josh Harling-Lee, Tim Regan, Barbara B. Shih, James Prendergast, David A. Hume, Tim Angus; Graphia: A platform for the graph-based visualisation and analysis of high dimensional data
Graphia has been used in many publications, in a variety of contexts. If you would like your publication to appear here, please let us know.
Privacy
Graphia does not track what analyses you perform or retain any data loaded into it – your privacy is assured. This applies to all versions of Graphia, including web. We do request an email address in order that we can track overall usage of the application, but this is voluntary; you can choose to use Graphia anonymously if you prefer.
Help
If you have a question about how to do something that isn’t explained in the user guide, a suggestion for a feature or just want to discuss Graphia in some way, please use the discussions section on GitHub. If you believe you’re experiencing a bug, please report it in the issues section on GitHub and we will endeavour to solve it. For any other more general queries, email us directly: info@graphia.app.
Acknowledgements
We would like to thank those who have helped us develop Graphia: