A Short Introduction to Graphs
Introduction
Many types of data are best understood when represented and analysed as a graph. Fundamentally, graphs are structures comprised of nodes and edges, where the nodes represent entities and the edges represent relationships between said nodes. Graphs may be used as a powerful medium to understand complex data or systems. When data is visualised as a graph, large amounts of information can be explored on a global or local scale.
For many reading this, graph based analysis approaches may be relatively unfamiliar. The purpose of these pages is therefore to introduce various ideas and concepts of this approach to data analysis and demonstrate how graph analysis can be used. In so doing, we hope to be able to show you how graph analysis could allow you interact and understand your complex data in a completely different way.
There is often confusion between the terms, graph, plot and chart, which are frequently used interchangeably. Plots and charts typically have axes, with data displayed as a line, bar or point. We refer to graphs in the mathematical sense, involving nodes and edges. Graphs are also commonly referred to as networks.
Graphs are a means of describing any set of relationships or associations between entities. For example, they can be used to represent communication networks, customer-client interactions, social media contacts, language structure, financial transactions or biological data. The area of mathematics focused on graphs is known as graph theory.
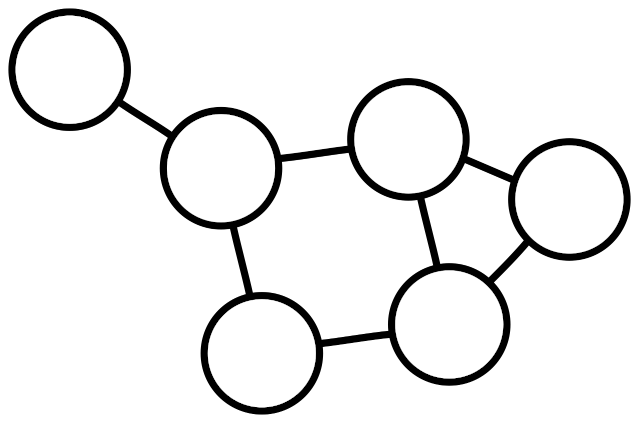
Nodes and edges are abstractions of real world data. Nodes represent entities, while edges represent relationships between them. Additional information may be associated with the nodes or edges of a graph. In Graphia we call this information attribute data. For example if a node represents a person, we might also have attributes describing their age, height, diet, etc.. Similarly, the relationship between each person is represented by an edge, and an edge attribute could refer to the nature of that relationship, for example sibling or coworker. It is common to want to understand the structure of the relationships observed, in the context these data, i.e. does an observed grouping of individuals share a particular attribute or characteristic?
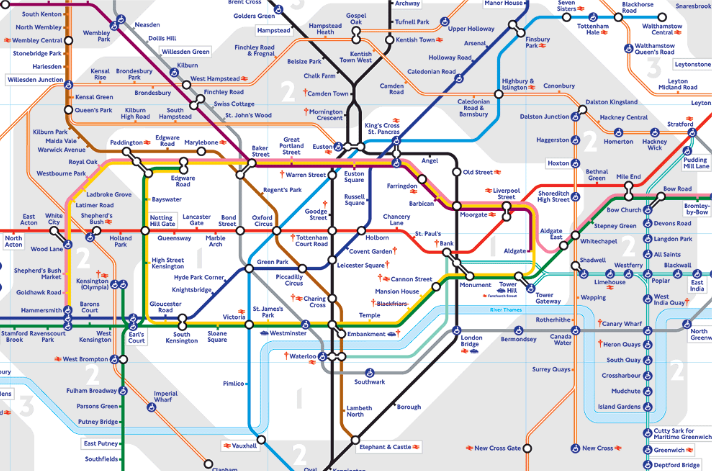
One of the best known examples of a graph is the map of the London Underground. The now iconic representation of stations (nodes) and underground lines (edges), simplified travel and improved route planning across the city for everyone.