What Type of Data Can I Explore and Analyse?
Types of Data
Many types of data are inherently a network of relationships, whether that be between companies and clients, relations between family members, communications between things or interactions between proteins. As such, these data can all be visualised and explored as a graph.
Other types of data take the form of a numerical table of measurements defined across many conditions or time points. Examples include time course data associated monitoring devices, share prices, or the result of gene expression analysis across samples, questionnaire data or even present/absence scores. In this case, irrespective of origin or the nature of the values, correlation analysis may be used. Here the data associated with each entity is compared to the data of every other entity and a correlation score is computed. This is then used as guide to create edges between graph nodes, by using a threshold correlation value below which no edges are created. This allows groups of entities exhibiting a similar behaviour to be easily identified as they form highly connected groups within the graph. It is then easy to quickly spot major trends and patterns in the data.
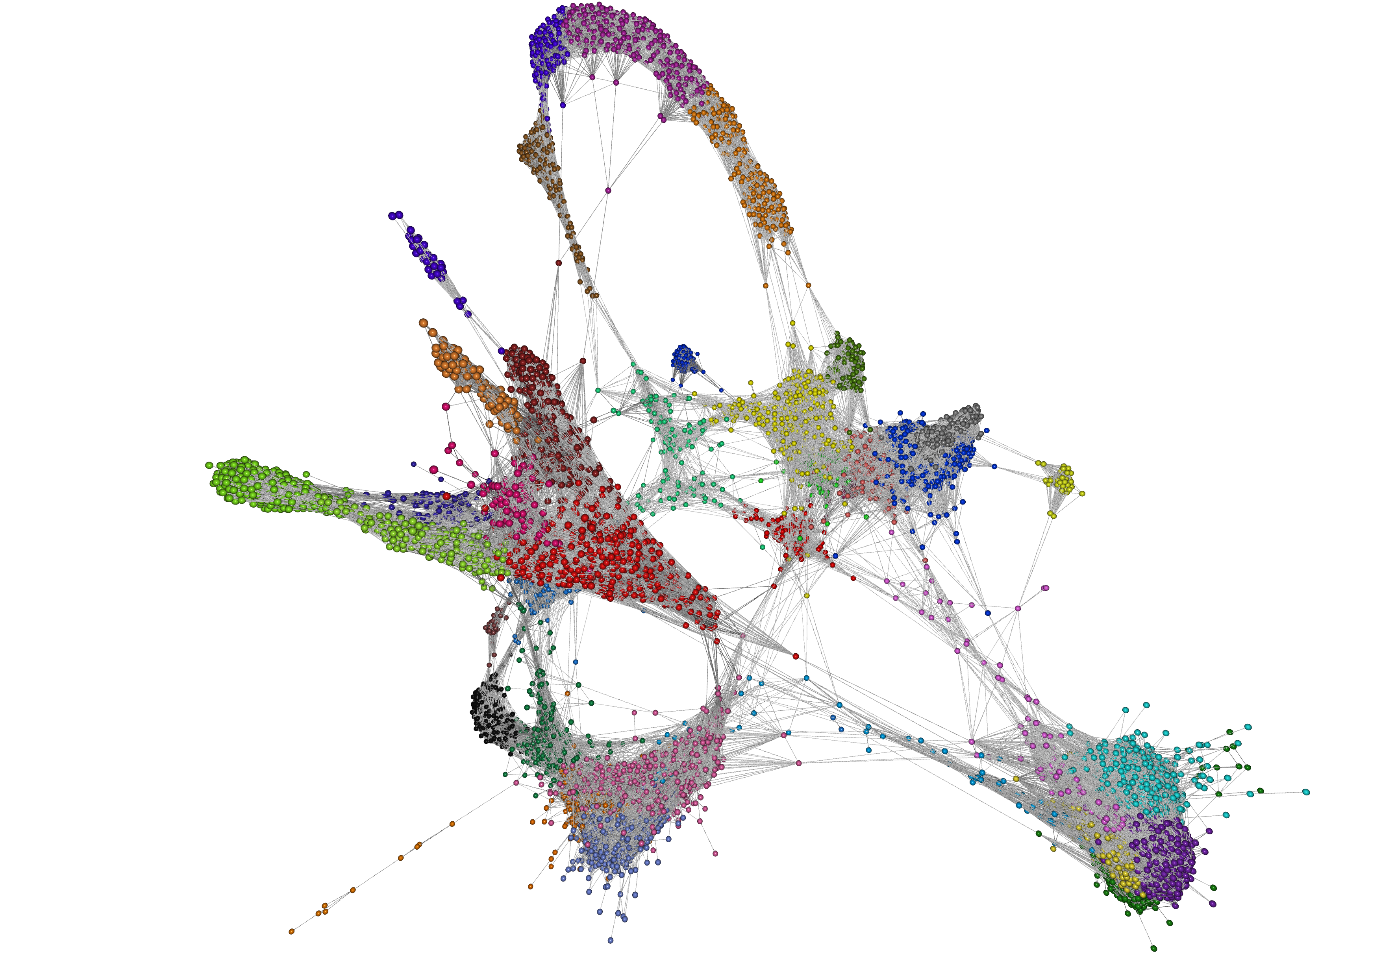
Depending on the input data, graphs can grow to be very large. Graphia has been specifically designed to visualise and explore larger graphs, composed of millions of nodes and edges.