First Start
First Start
Once running Graphia, you will be greeted with an introductory dataset and a simple tutorial. This tutorial dataset uses a graph of the London Underground and Riverbus Networks. The tutorial will guide you through simple interactions with the graph. Once closed, you can reopen the tutorial by going to Help → Show Tutorial.
Main Window
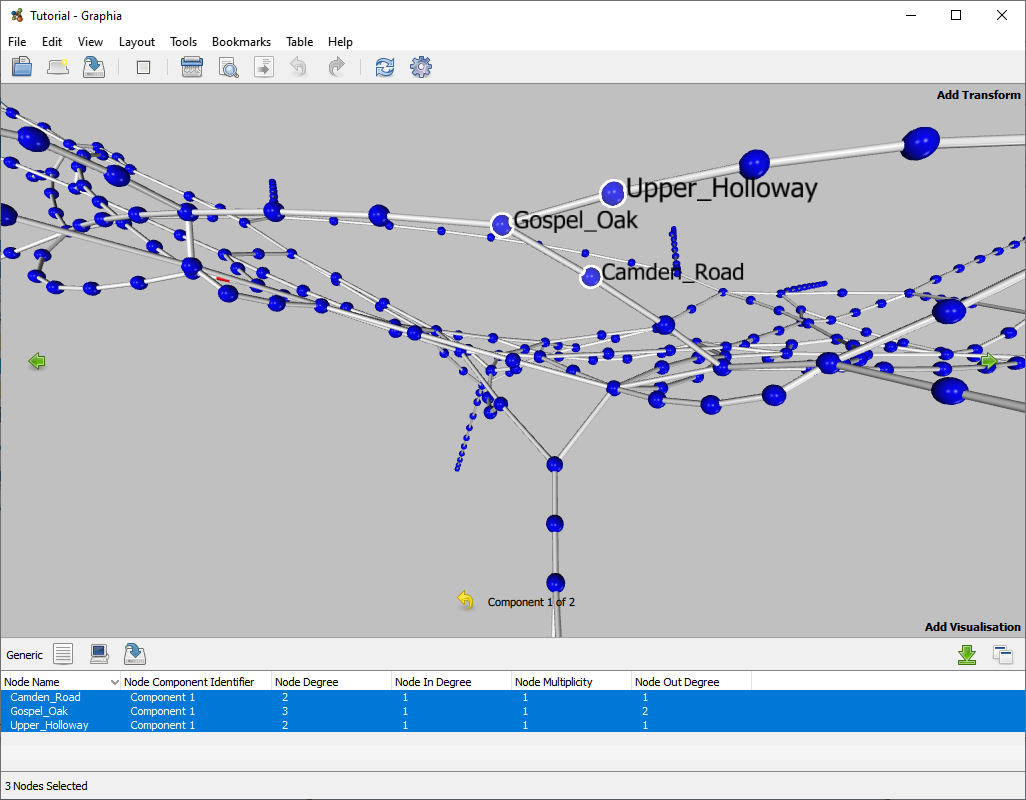
Central to the main window is the graph display. In this context data can be explored, selected, removed, searched and visualised. Millions of data points and relationships can be viewed at one time, or small areas of the graph may be focused upon.
Node Attribute Table
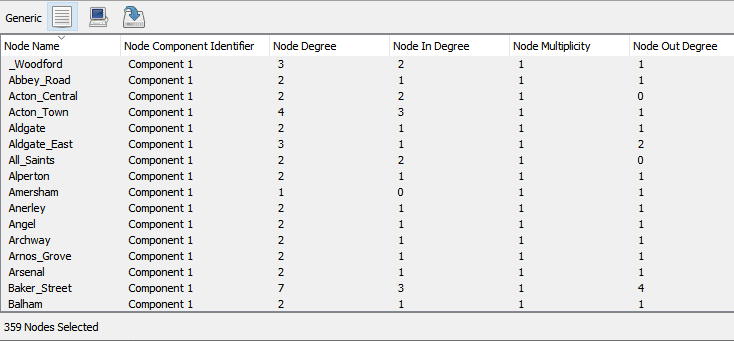
The node attribute table displays the attribute information associated with the selected nodes. Columns of data can be hidden from view and selections exported as a table. In the case of the tutorial data, each node is associated with the name of a station plus some additional calculated attributes based on the generated graph.
Toolbar
Along the top of the window is the tool bar, for quick access to frequently used features. These functions can also be accessed through use the menu bar or using hotkeys.
By default extended tool tips are displayed when the mouse is hovered over elements of the user interface. These can be disabled via the Options window.
![]()
Setting Layout Preferences
Graphia uses a force directed layout algorithm, the results of which are displayed to the user as they occur. Graphia’s layout algorithm can be used to display even massive graphs quickly, defining the position of nodes and edges in 2D or 3D space. Layout can be paused and resumed from the Layout menu, or via the corresponding button on the toolbar. To optimise visualisation, parameters can be tweaked by selecting the Settings option from the Layout menu. This shows a inset user interface in the bottom left of the graph that allows for adjustment of the force settings in real time. The current node layout can be exported to file via the Layout menu, and reloaded later if and when required.
Graph Visualisation Options
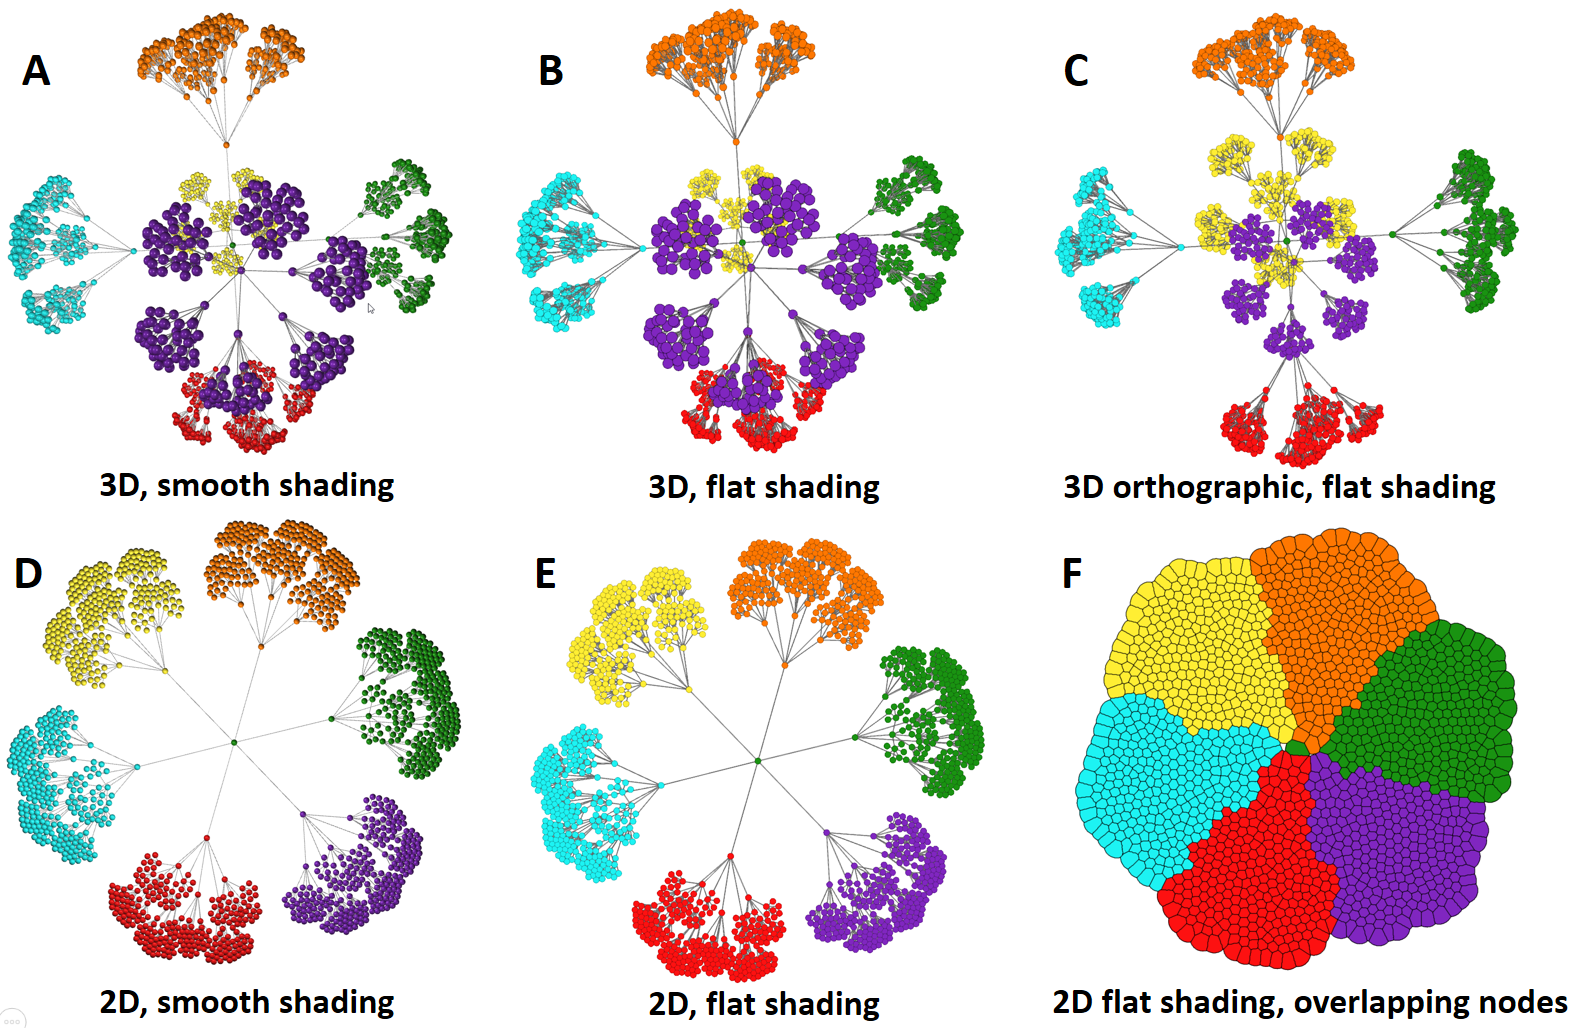
Graphia supports graph visualisation in both 2D and 3D. Options for setting visualisation mode are found towards the bottom of the View menu. The default setting is to display graphs in 3D and to use smooth 3D shading (A). This can be changed to flat shading while still displaying the graph in 3D (B). Orthographic view makes all node the same size but still rendered in 3D, perspective of distance is not applied - useful when displaying encodings using node size to distinguish between attributes in a 3D setting (C). A 2D graph can be displayed with smooth (D) or flat shading (E) and when node density is high, node/edge outline tracing (flat view only) helps visualisation (F).
The size and colour defaults of nodes and edges may be set to suit the preferences of the user in the Options Window, accesible via the Edit menu or from the corresponding toolbar button, but for changing the size of graph elements on-the-fly, on a per-graph basis, use the Settings option in the Layout menu. The rendering of edges can be disabled entirely via the Show Edges option in the View menu.
Graph Navigation
Graphs may be large and complex structures. To understand such complexity a user needs to be able find their way around them. Graphia allows a user to view a graph from any angle, zoom in on a given node or pan out or view a graph as a whole.
You can interact with the graph directly using your mouse.
- Rotate the graph, click the left mouse button and drag
- Pan the graph, click right mouse and drag
- Zoom in or out using the mouse wheel
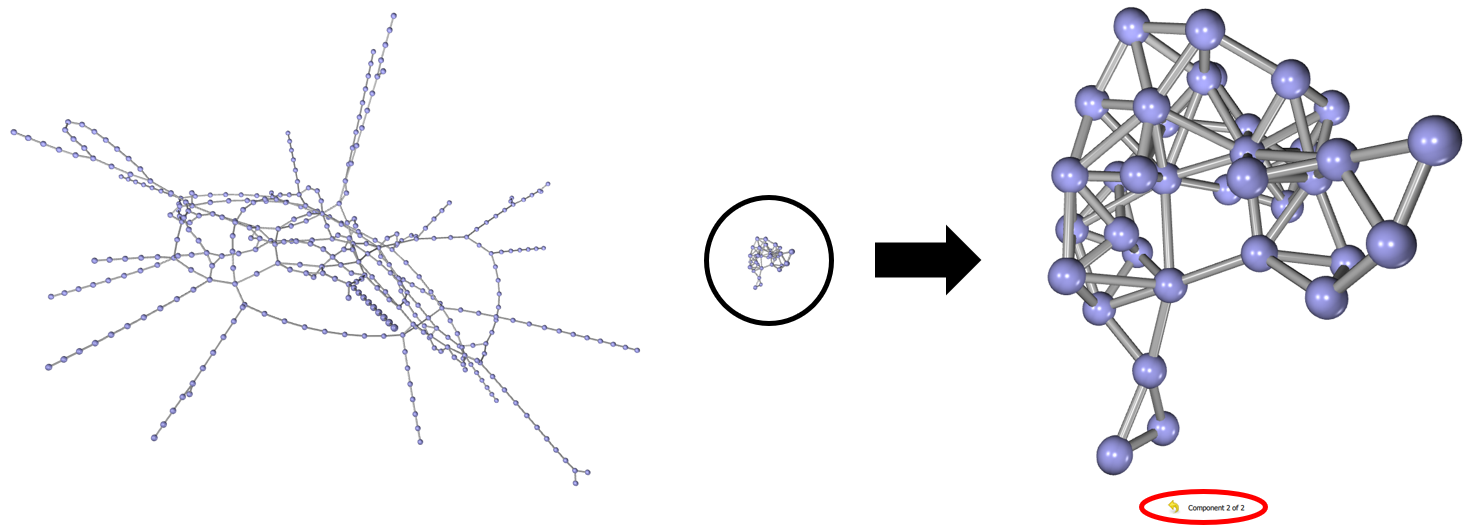
There are two graph visualisation modes. Overview Mode provides a view of the entire graph and all its components. Component Mode provides a focused view on a particular graph component or a node within it. For example there are two components contained within London Transport graph, one is the London tube map, the second is the Riverbus network. These are displayed as separate components in overview mode as they are not connected to each other.
You can interact with nodes by clicking on them with your mouse:
- Focus on a specific node by double clicking it
- Select a single node by clicking it
- Select multiple nodes by holding shift, then drag a selection rectangle using the mouse
- View a component by double clicking it
- Return to Overview Mode by clicking the back arrow at the bottom of the screen, or press Esc
- Right click nodes to bring up the context menu for additional actions
Searching for information within a graph
Graphia has multiple ways to find nodes. Selecting Find from the Edit menu allows the user to search for all the nodes whose names or attributes contain the given search term. Clicking the left or right arrows moves the display to each found node. For a more targetted search, the Advanced Find option can be used. This allows the user to restrict their searches to particular attributes, and select whether to match case etc.. Finally, nodes can be found based on shared attribute value, that is to say that the user can select and view all the nodes that share a particular attribute values. This is particularly useful following the application of a clustering transform. For example, using Find By Attribute Value it is possible to select all the nodes contained in one cluster, then move to the next cluster, and so on.
Example Data
We provide a number of example files for you to download and explore on our Example Datasets page.